debunker physicist Robert Wood.
These two facts—shallow interest from the public and the non-transparency of most diagramming schemes—have been recognized, blurred together, and exploited on several occasions by fame-seeking, flim-flamming, faux diagrammers, as we shall explore below.
But first, let us look briefly at two of the most successful forms of graphically representing language. First, Iconographic Diagrammation (Figure 3) has an exceptionally long history, and while some of the structural details of the utterance are typically lost, the major roles and relationships are clear to even the most apathetically casual observer. Seen by some as a strength and by others as a weakness, there is also much room for interpretation and creativity on the part of the diagrammer. This artistic license has no doubt inspired some of the diagrammation schemes that followed it. Second, Traditional Linguistic Syntax Trees (Figure 4) owe their success to their markedly unapathetic, even dedicated, following among linguists. What they lack in transparency to the public, they make up for in clarity to devotees. And while they fall from favor from time to time among the upper echelons of the field, mastering them seems more or less to be permanently ensconced as a right of passage for novices.
|
Iconographic Diagrammation
Fig. 3. The dog bit the man.
|
|
| |
|
Traditional Linguistic Syntax Tree
Fig. 4. The dog bit the man.
|
|
|
In the mid-1960s, nestled all snug in their ivory towers, and spurred by the visions of phrase structure rules and finite state automata that danced in their heads, an unnamed and unknown group of academicians (probably idly noodling around on a chalk board somewhere) gave birth to a sentence diagramming technique known as “Balloon Animal State Machines” (Figure 5). Clearly the name indicates that the idea was originally presented tongue-in-cheek. However, the model does seem to offer some descriptive and computational power. Several factors contributed to BASM’s eventual fade into history.
| |
|
Balloon Animal State Machine
Fig. 5. The dog bit the man.
|
|
|
First, there was an overwhelming tendency by both supporters and detractors of BASMs to shape their diagrams to look as much like balloon animals as possible. Sometimes this desire of format over-ruled the needs of the linguistic content in the diagram—at times so much so that it was difficult to tell whether such “cute” shapes were being designed by overenthusiastic supporters or sarcastic detractors. Luminaries such as Mario Pei, who supported BASMs, and Roman Jakobson, who did not, have admitted in later writings (Jakobson 1973, Pei 1978) to corrupting their linguistic analyses to support their artistic intent when using BASMs.
Further, there was no singular source to state definitively how the scheme worked or should work, and as a result, odd inconsistencies in use cropped up, especially between East Coast and West Coast linguists in the U.S. Coupled with the inescapable aura of insincerity surrounding BASMs, this defect in their admirably organic development sealed their eventual ignominious fate.
By 1971 it seemed that a number of enterprising would-be diagrammers, having seen the writing on the wall for BASMs, tried to construct new engines of diagrammation on the foundations of their failing, sometimes even flailing, precursor. In the spring of that year, a previously unknown author, Hamy Mockson, rocketed onto the scene with his “Undulating Transition Flow Chart” (Mockson 1971). Mockson’s description of the UTFC seemed very scientific: the left-right and up-down directions of the arrows, the fraction of a circle used in the arrow, and the second derivative of the arrow (indicating over-arcing vs. under-arcing) were all distinctive and laden with syntactic meaning. The novel representation of compound words generated much interest. Only one example was given by Mockson, though, and it is reproduced in Figure 6.
By the summer of 1971, there were two main camps of linguists, those who thought UTFCs were useful, and those who thought they were not. Almost everyone who thought about them, though, took them quite seriously. But by the fall, rumors where flying fast and furious that Mockson was a fake, and UTFCs a joke. “Hamy Mockson” is an anagram of, and was for years a suspected (but never proven) pseudonym of, Noam Chomsky. Also, “Hamy” is orthographically and phonetically close to “hammy”, and “Mockson” could be analyzed as containing the morpheme “mock”—which was ample evidence to convince Joseph Greenberg that it was all a big send up, and he publicly stated as much in a letter to Language (Greenberg 1971). The suddenly obvious contrivance of the word “undulating” in the name of the model, the sibilant alliteration, and snake-heavy example embarrassed many linguists.
|
Undulating Transition Flow Chart
Fig. 6. The snake slithered silkily along the sidewalk.
|
|
| |
|
Double-Ruled Rectilinear Syntax Grid
Fig. 7. The giraffe laughed heartily.
|
|
|
Unfortunately for one Walter M. Spanderblau, creator of the “Double-Ruled Rectilinear Syntax Grid”, his inaugural paper—“Rectilinear Syntax Grids for Visual Interpretation of Syntactic Structures,” (Spanderblau 1971) in which he carefully constructs then devastatingly deconstructs a theory of single-ruled rectilinear syntax grids, ultimately discarding it in carefully-reasoned favor of double-ruled rectilinear syntax grids—appeared in the same volume of Language, and was read by almost no one. His initial example (Figure 7) mentioned a giraffe, and looked vaguely giraffe-like. It also appeared on a page facing Greenberg’s nasty note on UTFCs.
Neither Spanderblau nor his theory ever recovered. While many linguists, as usual, were hesitant to jump to conclusions as fast as Greenberg, most began to distance themselves from the Mockson/UTFC discussion, and none would approach Spanderblau’s
|
Venn Scoping Diagram
A. B.
B.
Fig. 8.
A. a bachelor is an unmarried man
B. an unmarried man is a bachelor
|
|
|
|
elegant model. In disgust, Spanderblau left linguistics and became a relatively famous electrical engineer, until his untimely death in an accident that occurred while he was overseeing the installation of a lighting system he had designed, somewhat ironically, for a giraffe exhibit at the San Diego Zoo.
For almost two decades, no one in the field of linguistics seemed willing to propose a radical new model to challenge the hegemony of traditional syntax trees. The intertwined shadow of the Mockson and Spanderblau debacles was quite long.
Minimal use of the well-established Venn diagrams to demonstrate simple issues of semantics and scoping (Figure 8) continued through this period.
Finally, in 1989 or so, as a bad case of physics envy was once again sweeping through the field, certain linguists began to feel that traditional syntax trees were old and tired, had been co-opted by computer scientists, and certainly were no longer emblematic of the best that linguistics has to offer. Then came several attempts to, in turn, co-opt certain diagrammatical schemas from seemingly more scientific fields.
The first was the Free Body Role and Reference Diagram (Figure 9), obviously adapted from standard free body diagrams in physics. As very few linguists actually ever really understood Role and Reference Grammar anyway, none were able to intelligently comment on the new sentence diagramming method, and it passed with little notice (Van Valin 1992).
|
Free Body Role and Reference Diagram
Fig. 9. The weight slipped down
the incline in the physics lab.
|
|
| |
|
Sociolinguistic Peer/Pressure
Phrase Transition Diagram
Fig. 10. She is going through a phase.
|
|
|
Sociolinguists had more success with their Peer/Pressure Phrase Transition Diagram (Figure 10), adapted from chemistry phase diagrams. Some (Labov 2001) have argued that other linguists’ use of this diagram (as in Tannen 1990) demonstrate a profound misunderstanding of nominative and accusative cases, as the “ergativity critical point” has no linguistic meaning or value—neither as psychological reality, nor even as theoretically useful abstraction. Others outside sociolinguistics (Akmajian 2001) have dismissed the entire Peer/Pressure Phrase Transition Diagram enterprise as “without merit, as meaningless and as much a muddle as the rest of sociolinguistics.” That viewpoint is perhaps not without merit.
The late 1990s and the new century have ushered in a mild resurgence of special-purpose diagramming techniques, often based on the eclectic and even eccentric inter-disciplinary melding of models. Out of the abstruse field of computational semantics has come the Voronoi Semantic Distance Diagram (Figure 11). As both formal semantics and Voronoi diagrams are beyond the ken of most linguists, we cannot dwell here on this topic.
|
Voronoi Semantic Distance Diagram
Fig. 11. A Voronoi diagram partitions a plane with n points into convex polygons such that each contains one generating point and all points within a polygon are closer to their generating point than to any other.
|
|
Feynman Syntax Diagrams (Figure 12) and Semantic Circuit Diagrams (Figure 13) are blends of linguistics with physics and electrical engineering diagrams (respectively). Neither has caught on outside of small cadres at the MIT Linguistic Lab and Stanford Linguistic Accelerator Center (respectively).
|
Feynman Syntax Diagram
Fig. 12. On the other hand, Feynman diagrams are easy.
|
|
| |
|
Semantic Circuit Diagram
Fig. 13. All My Circuits is my favorite soap opera.
|
|
|
One of the most arcane diagrammation methods yet constructed is the Feigenbaum Tree for Infinite Self-Referential Sentences (Davidovitch 2000, see Figure 14). The fractal nature of the tree gives it an infinite number of nodes arranged in a self-similar pattern, allowing for, for example, infinite self-referential center embedding.
|
Feigenbaum Tree for Infinite Self-Referential Sentences
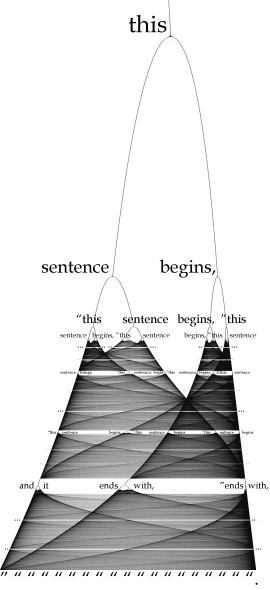
Fig. 14. This sentence begins, “This sentence begins, “This sentence begins, “This sentence begins, “This sentence begins, “This sentence begins, ... and it ends with, “ends with, “ends with, “ends with, “ends with,
“ends with ...” ” ” ” ” ”.
|
|
| |
|
Multi-Dimensional Vector Difference Model (Graphical)
Fig. 15. Math is a very hard subject.
|
|
|
|
Multi-Dimensional Vector Difference Model (Textual)
< 1,1,3,1 > → math

< 2,1,3,1 > → is

< 5,1,0,0 > → a

< 4,0,0,0 > → very

< 3,0,0,0 > → hard

< 1,1,3,2 > → subject
|
< p.o.s.,number,person,case >
Fig 16. Math is a very hard subject.
|
|
|
The last diagramming model of note is the Multi-Dimensional Vector Difference Model (Figure 15), originating with computer scientists (Penton 2004). Unfortunately the multi-dimensional nature of linguistic phenomena limits the usefulness of the graphical representation. The sample shown here is limited to only four dimensions, but ten or twelve dimensions are needed for typical phenomena, and twenty are not unheard of. The MDVDM has been abandoned (except among a small cult of palindromic acronym fetishists) as too visually complex. A short-lived offshoot, the textual Multi-Dimensional Vector Difference Model (Figure 16), was proposed, but quickly abandoned because it didn’t actually use vector differences, and was not sufficiently visually complex to make its proponents look “crazy sexy smart” (Pulju 2007, Slater 2007, Jones 2007).
What the future of Linguistical Diagrammation may hold none can predict. However, if the past is any indication at all, it is certain to be creative, ingenious, plagiaristic (or, perhaps, “inter-disciplinary”), and, ultimately, useless.
References
- Akmajian, Adrian, Richard A. Demers, Ann K. Farmer, and Robert M. Harnish, 2001. Linguistics: An Introduction to Language and Communication (5th Edition).
- Bloomfield, Leonard, 1939. Linguistic Aspects of Science.
- Clark, W.S., 1860. A Practical Grammar: in which Words, Phrases & Sentences are Classified According to Their Offices and Their Various Relationships to One Another.
- Davidovitch, Benny, Mitchell Jay Feigenbaum, Hilary George Everard Hentschel, and Itamar Procaccia, 2000. “Conformal dynamics of fractal growth patterns without randomness.” Physical Review E, 62(2):1706-1715.
- Florey, Kitty Burns, 2006. Sister Bernadette’s Barking Dog.
- Greenberg, Joseph, 1971. “Mocking linguists with a hammy mock theory.” Language 47.3.
- Jackendoff, Ray, 1990. Semantic Structures.
- Jakobson, Roman, 1973. Questions de poetique.
- Jespersen, Otto, 1889. The Articulations of Speech Sounds Represented by Means of Analphabetic Symbols.
- Jones, Trey, 2007. “Can someone disable Pulju and Slater’s ability to send out mass mailings again?” SpecGram Editors Mailing List, February 6, 2007.
- Klotz, Irving M., 1980. “The N-ray affair.” Scientific American, May 1980.
- Labov, William, 2001. Studies in Sociolinguistics.
- Manning, Christopher D. and Hinrich Schütze, 1999. Foundations of Statistical Natural Language Processing.
- McCawley. James D., 1982. Thirty Million Theories of Grammar.
- Mockson, Hamy, 1971. “Undulating Transition Flow Charts: The serious linguist’s BASM.” Language 47.1.
- Pei, Mario, 1978. Weasel Words: Saying What You Don’t Mean.
- Penton, David, Catherine Bow, Steven Bird, and Baden Hughes, 2004. “Towards a General Model for Linguistic Paradigms.” Proceedings of EMELD 2004.
- Pulju, Timothy, 2007. “Have you heard what Keith Slater is doing these days?” SpecGram Editors Mailing List, February 4, 2007.
- Reed, Alonzo and Brainerd Kellogg, 1877. Higher Lessons in English.
- Slater, Keith, 2007. “Tim Pulju is spreading baseless rumors about me again.” SpecGram Editors Mailing List, February 5, 2007.
- Spanderblau, Walter Mitty, 1971. “Rectilinear Syntax Grids for Visual Interpretation of Syntactic Structures.” Language 47.3.
- Tannen, Deborah, 1990. You Just Don’t Understand: Women and Men in Conversation.
- Van Valin, Robert D., Jr., 1992. “Generalized Semantic Roles, Argument Selection and the Syntax-Semantics Interface.” Ms. State University of New York at Buffalo.
- von Wilamowitz-Moellendorff, Enno Friedrich Wichard Ulrich, 1884. Homerische Untersuchungen.
 |
Special Supplemental Letter from the Editor |
 |
SpecGram Vol CLIII, No δ Contents |